From B2B to the fan | NILO Studio
From B2B to the fan
How a US $4M-a-year B2B wholesale operator used the 2026 World Cup to test its first B2C expansion: selling direct to the end fan, in a closed six-week window.
Client
Sports-travel ticketing operator
Scale
US$ 4M annual revenue
Where
UAE · Global demand
What
B2B → B2C launch
4.2×
Return on ad spend
$32K
Revenue generated
$1.4K
Avg ticket sold
01
The Challenge
$4M in revenue, and no line to the fan in the seat
A US $4M-a-year B2B business, built on agencies, companies and intermediaries, that had never sold to an end customer. The model worked, but the ceiling was clear. The 2026 World Cup (104 matches, three host countries, six weeks) was the window to test whether the same operator could go direct-to-fan.
The mandate was to use the tournament as a proof of concept for B2C: prove the economics work at small scale, build a direct channel to the fan, and earn the right to grow it beyond the World Cup. A budget that had to justify itself before it could expand.
Six weeks. 104 matches.
02
The Method
We let the resale market tell us where the money was
Most operators allocate budget by feel: marquee teams, popular fixtures, gut instinct. We did the opposite: before committing a single dollar, we built a strategy. Which fixtures, which audiences, which channels, in what order. All defined before anything went live. The spend followed the strategy, not the other way around.
Step 01
The Framework
We built the strategy first. Two parallel approaches running simultaneously: one match by match, one always-on. Different demand, different logic, same window.
Strategy A · Match-specific
Active demand. One campaign per fixture, only for the 24 matches that cleared the selection model.
Strategy B · Generic
Latent demand. Fixed regional blocks running always-on across 10 markets for the full tournament window.
Step 02
The Timeline
The campaign ran in three waves, each with a defined objective. Budget only scaled when the economics proved out.
Wave 1 · 4–17 Jun
+Test & Learn
Only top-priority matches. Every dollar bought data first: cost per sale, click quality, drop-off at each stage.
Checkpoint · 17 Jun
+Decision point
A hard rule: if the economics worked, scale. If not, fix creative and audiences before spending more.
Wave 2 · 17–27 Jun
+Scale
Winning campaigns scaled; lookalike audiences and retargeting added, now backed by real data, not hypotheses.
Wave 3 · Knockouts
+Premium & global
Confirmed teams, higher ticket values, ultra-segmented audiences. Budget moved from per-match to global.
Step 03
The Data Model
Before activating a single fixture, every match went through a four-step selection model. Only those that cleared all criteria became live campaigns.
A
Scrape the market
Four marketplaces, ~350,000 live listings, 6,000+ data points: average prices, inventory depth and entry cost for every fixture.
B
Read three signals
Market Tension (scarce & pricey = real demand), Price Level (margin per ticket) and Accessibility (entry price = conversion potential).
C
Score twice
A Revenue Score (Tension + Price) and a Conversion Score (Tension + Accessibility), each graded 3 / 2 / 1 against tournament percentiles.
D
Map & select
Plot every match on the priority matrix and select only the top quadrants. 104 fixtures narrowed to the 24 where demand ran hottest.
Step 04
The Signals
From that raw data we read three signals for every match and combined them into two scores.
01 · Market Tension
Is demand real?
Few tickets at high prices means demand is real and urgent, not just noise.
02 · Price Level
How much margin?
The spread between resale price and cost price determines how much margin each ticket can carry.
03 · Accessibility
Will it convert?
A lower entry price means more potential buyers and easier conversion.
Step 05
The Matrix
We combined those signals into two scores: how much a match could earn, and how easily it would sell. Every fixture mapped on both.
Y axis
Revenue Score
How much a match could earn. Driven by scarcity and ticket price.
Market Tension + Price Level
X axis
Conversion Score
How easily a match would sell. Driven by entry-level price.
Accessibility
Step 06
The Budget
45%
of the media budget
Active demand. Ads tied to a specific fixture, aimed at fans who already know the match. Carries the spend through Waves 1 & 2, while there are still fixtures to target.
55%
of the media budget
Latent demand. Generic ads for fans who haven’t picked a match. Grows across the campaign and, in Wave 3, becomes the single global strategy as the two merge.
Step 07
The Audiences
Active demand. The fan already knows the match.
01 · Origin
Country of origin
Start where demand is born: the countries with a team in the match, in their language.
02 · Reach
Diaspora
Those same fans live everywhere. We follow them abroad, same language, same intent.
03 · Geo
Host city
Fans don’t follow the city. They follow the team. We find them wherever they landed.
Latent demand. Wants the World Cup, hasn’t picked a match. Split by language:
Both strategies shared the same interest layer. The base targeted ticketing platforms and live event audiences, people already operating in the ecosystem. From there, the pool was narrowed to affluent travellers (luxury goods, travel agencies, premium hospitality) to concentrate spend on those with the means and intent to buy premium tickets.
Step 08
The Channels
Three channels, each assigned a distinct role in the funnel.
01 · Capture
Google Search
Caught active intent: the fan already searching for tickets. English-language search reached the highest-value buyers.
02 · Generate
Meta
Manufactured demand among fans and retargeted them. Audiences built by origin, diaspora and host city.
03 · Close
Intended to close high-value tickets with direct attention. Drew traffic, but proved it couldn't close.
From the actual strategy
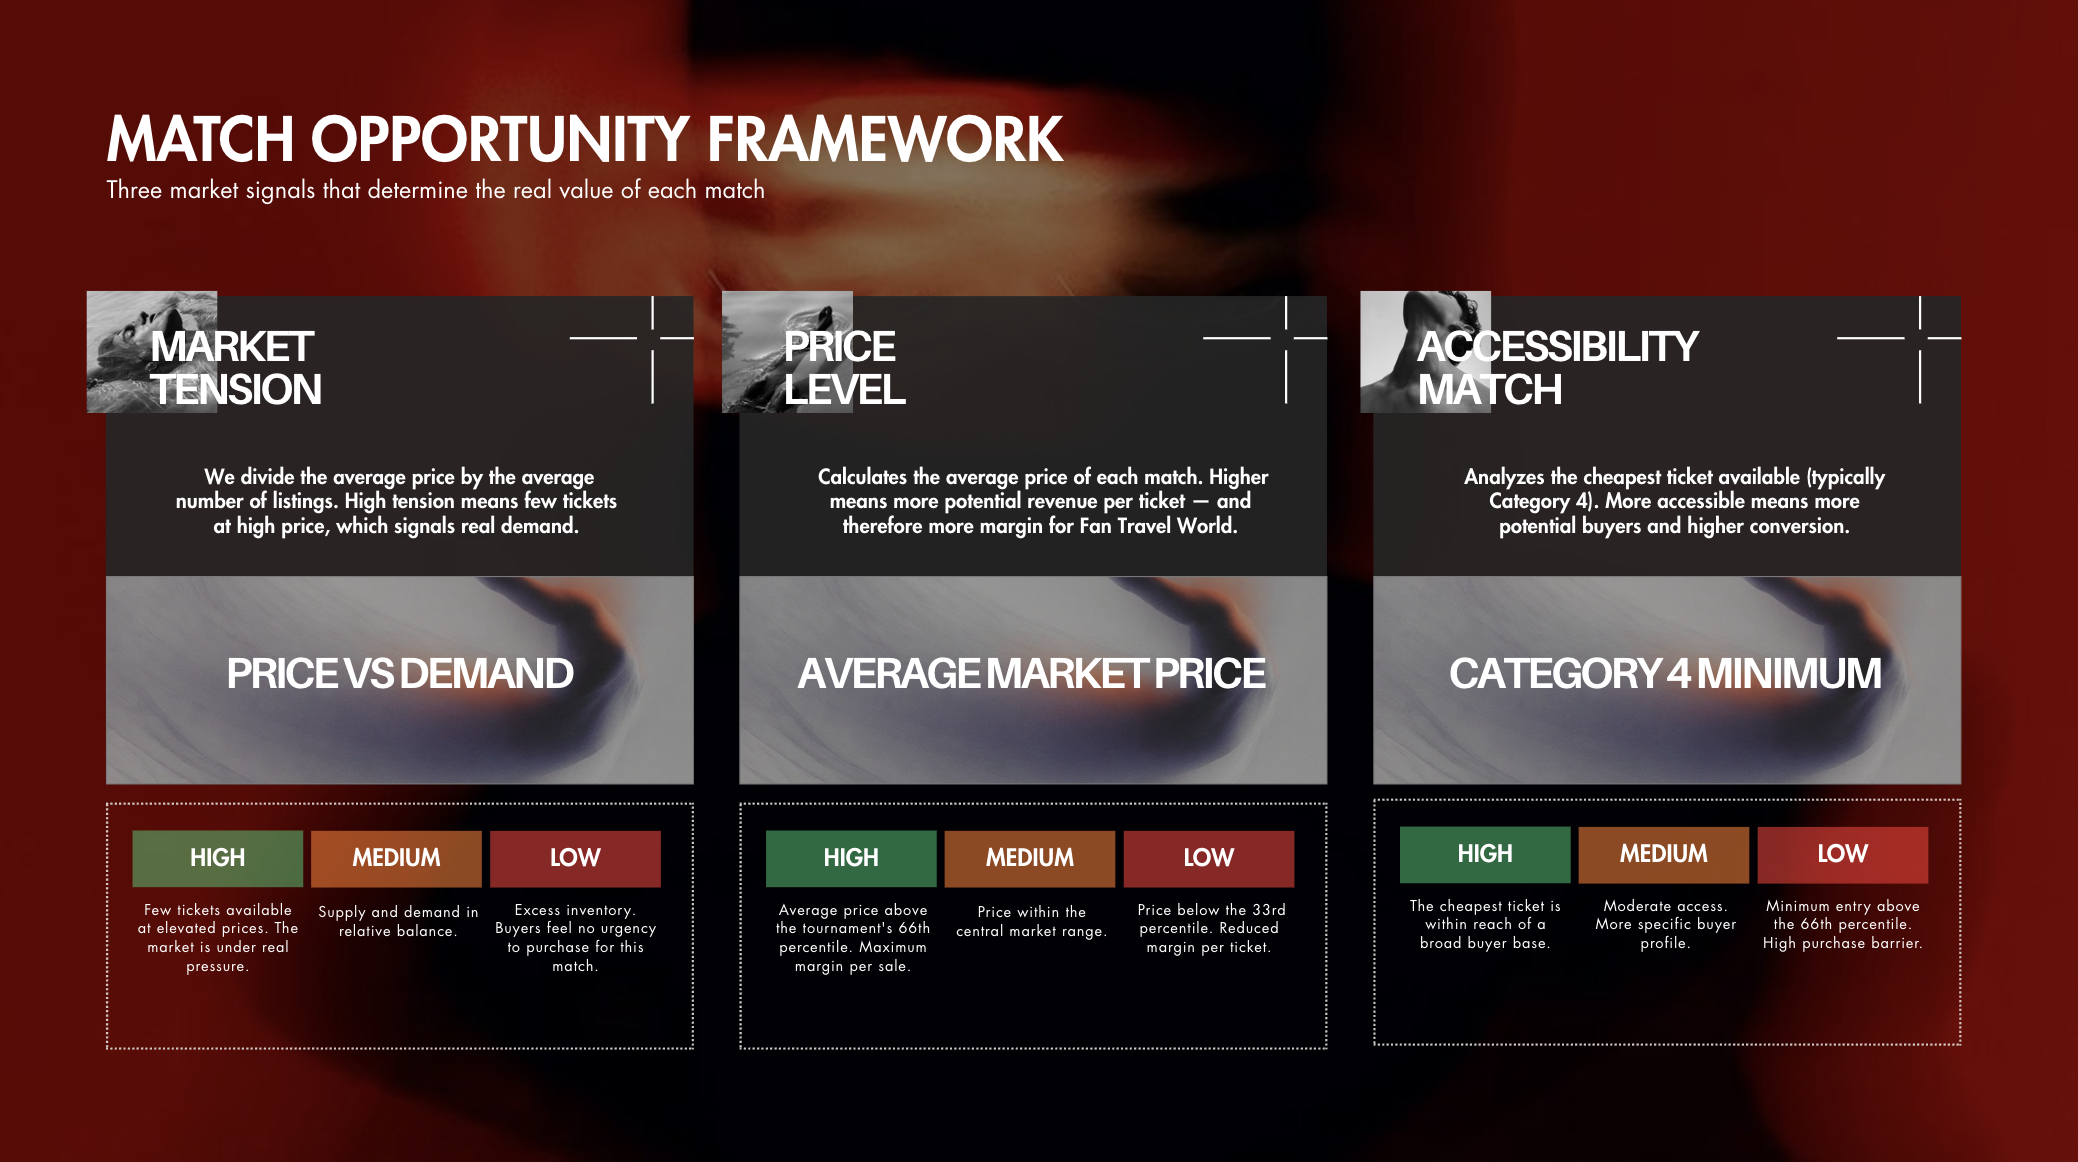
Three market signals score every match before any budget is committed.
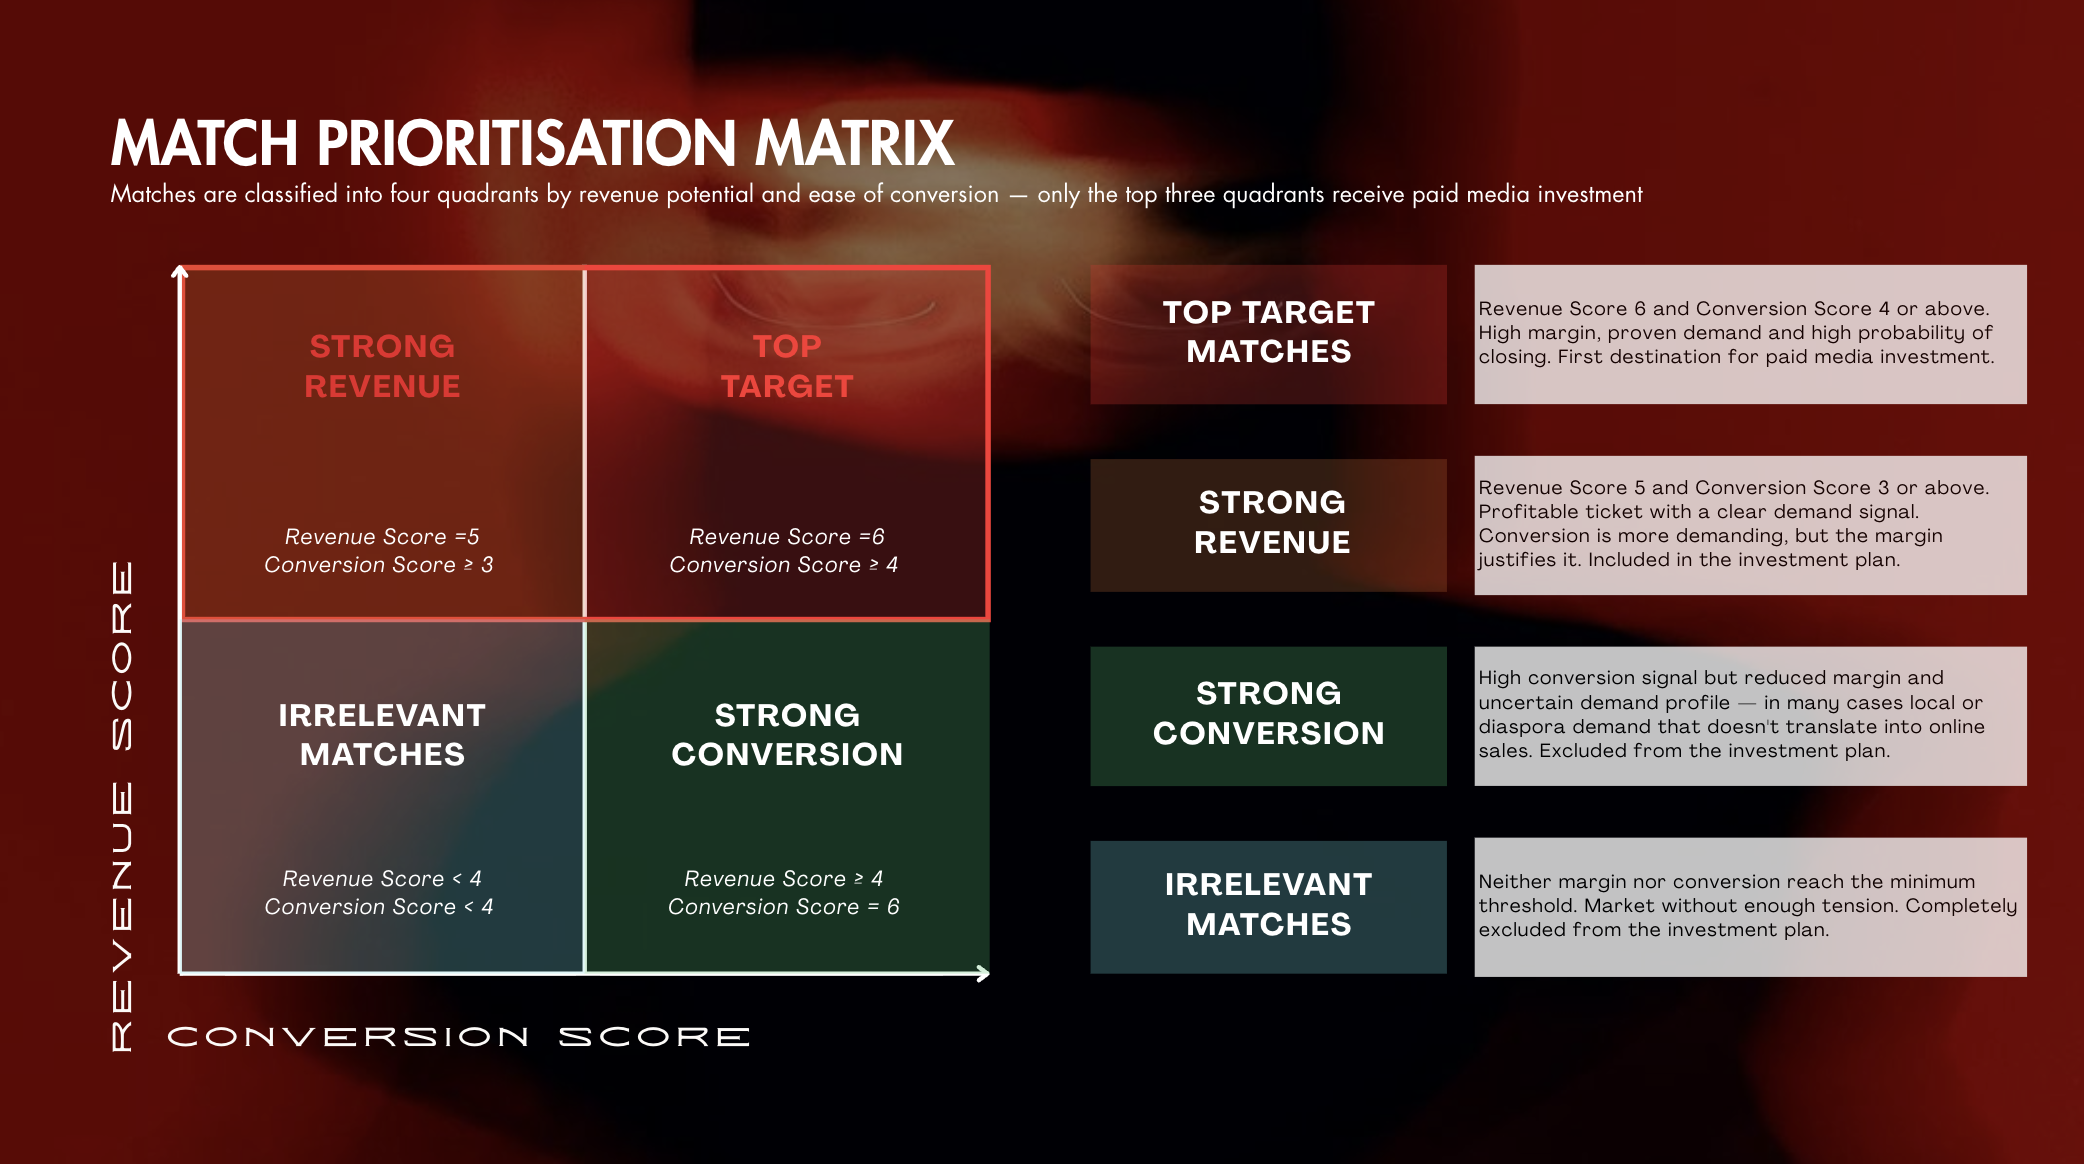
Only the top two quadrants receive paid media. The rest are left untouched.
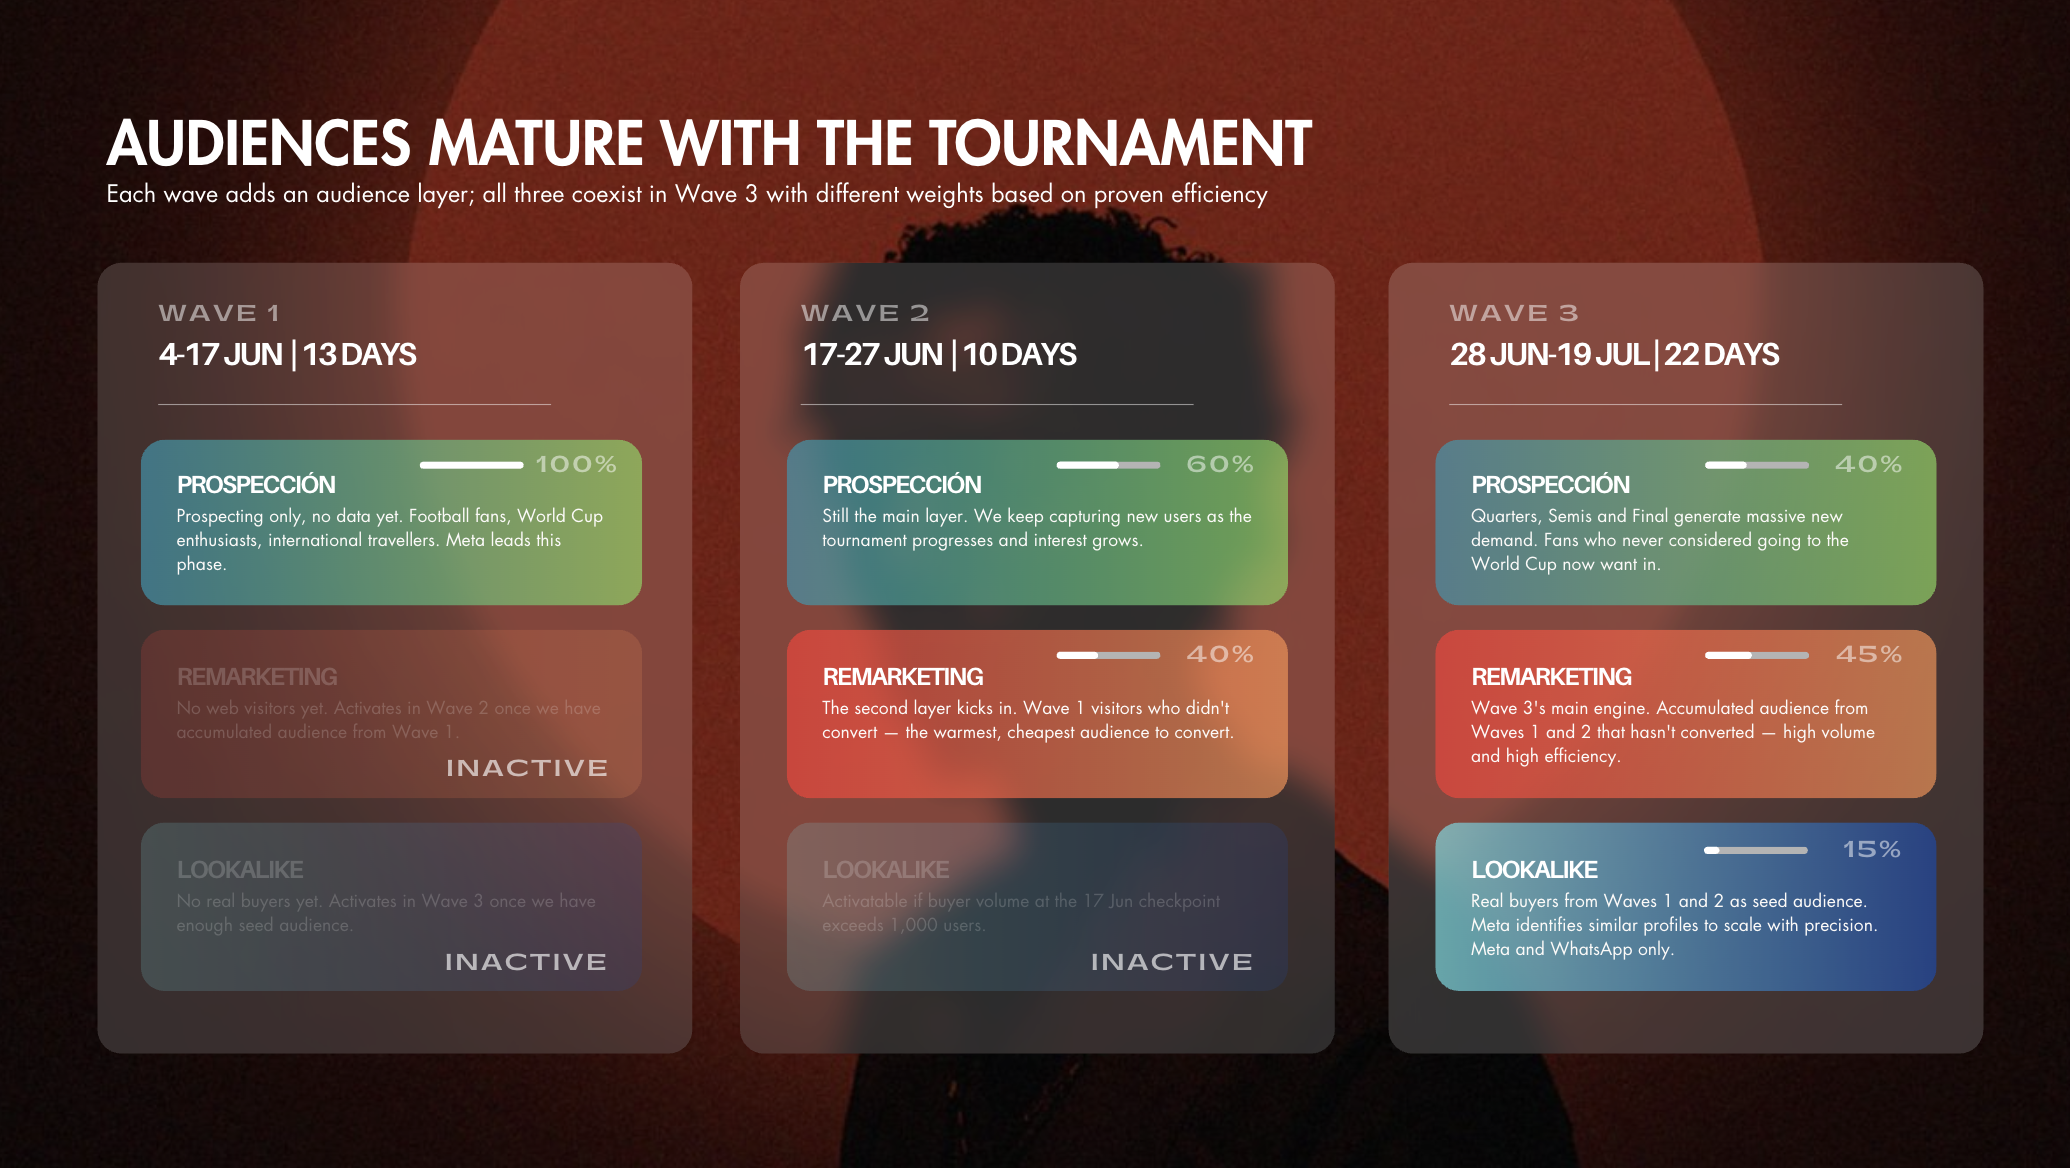
The audience stack builds across waves. Remarketing and lookalike activate only after the first conversions prove the model.
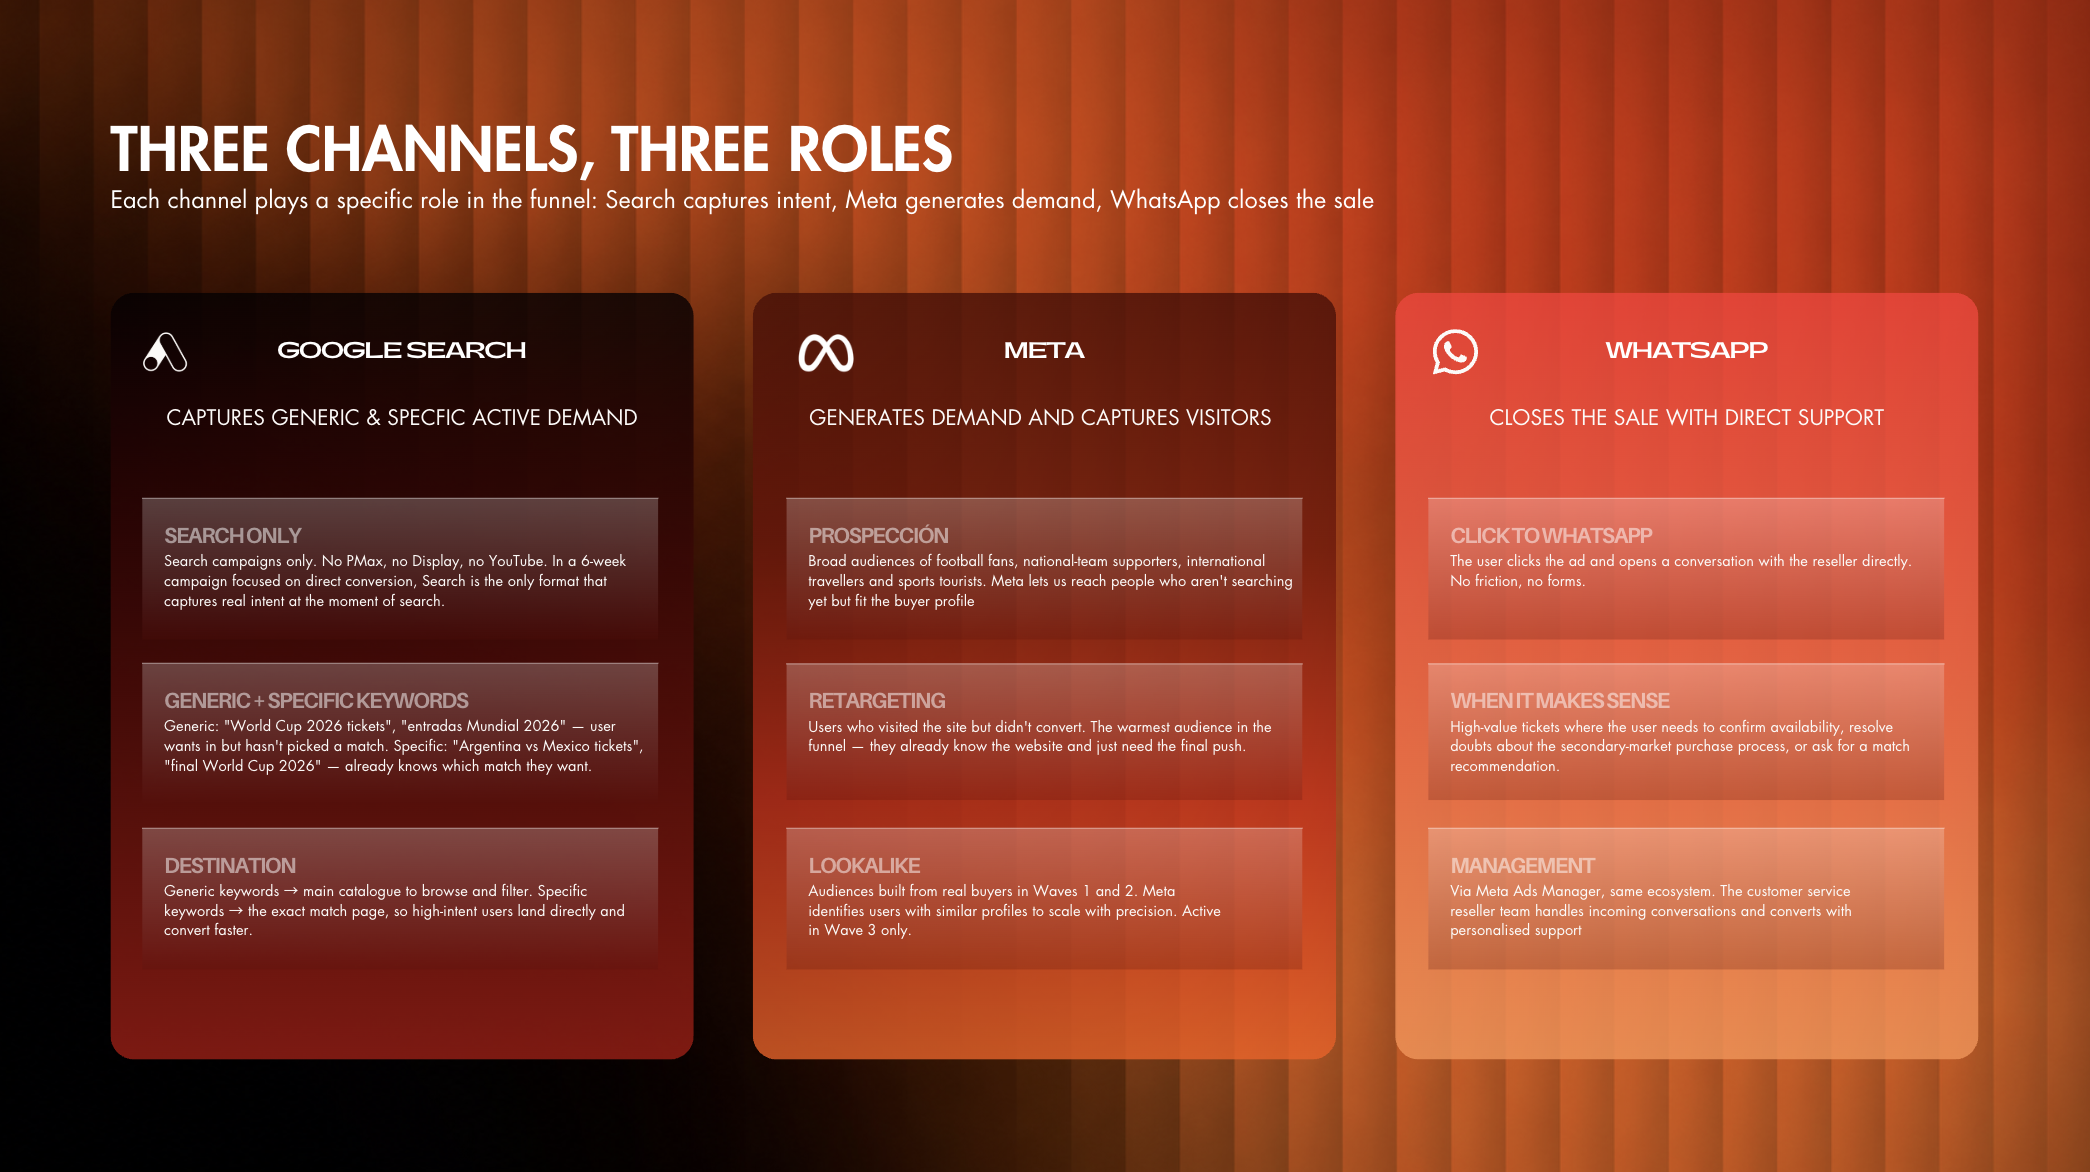
Search captures intent. Meta generates demand. WhatsApp closes the sale.
"We're not building a brand. We're earning the right to scale"
The operating principle behind the plan
03
The Result
A budget that earned the right to grow
Across 36 live days, the economics came in clearly. $7,540 in media produced $31.7K in confirmed ticket sales, with 995 checkouts started at an average ticket value of $1,629. For a first B2C campaign, built from scratch in a cold market with no audience history, that is a 4.2× return.
More than the ROAS, what the results validated was the selection model. The 24 matches that cleared the priority matrix drove almost all the return. The fixtures that didn't clear it were left untouched. That precision, not the media spend, was the edge.
Key metrics
return on ad spend across 36 days
in confirmed ticket sales from ~$7.5K in media
avg margin above floor price across all tickets sold
avg ticket value on activated fixtures, 3× the generic inventory
Main Conclusion
The data model was right about the buyer
What makes these numbers meaningful is the starting point: no prior campaigns, no social presence, no existing audience. Everything was built from zero. A 4.2× ROAS on a first-ever B2C campaign, with a cold market and no historical data to lean on, is not a ceiling. It's a floor. Every iteration from here compounds on a validated model.
Match-specific campaigns drove checkouts at a fraction of generic's cost. Knowing which fixtures had real demand was worth more than knowing how to run ads.
Fans follow their team, not the host country. Targeting by diaspora and country of origin outperformed targeting by venue city.
Search captured intent, Meta manufactured it. WhatsApp was meant to close, but a link without a system doesn't close.
Knowing which tickets to push, at what price and when, protected the ROAS as much as the media did. The campaign validated a B2C playbook now replicable across events.
Our POV
Performance marketing isn't a media-buying problem, it's a market-reading problem. Whoever wins a short, high-demand window isn't the one who spends the most, but the one who knows, before the first ad, exactly where demand is real and where the margin lives.
You don't need more ad spend.
You need to know where demand is real.
We work with businesses that have momentum, ambition and tension, but need sharper choices, clearer priorities and a point of view strong enough to build from.
If this sounds familiar, we should talk.
Let's Talk